Creating Custom Columns for reporting Call Conversions in Google Ads
Step 1
We will be creating 3 custom columns:
-
Calls – Total number of calls you’ll receive through Google Ads
-
Cost/Call – Average cost you spend to get receive call
-
Call % – Conversion Rate (Volume of Calls ÷ Clicks)
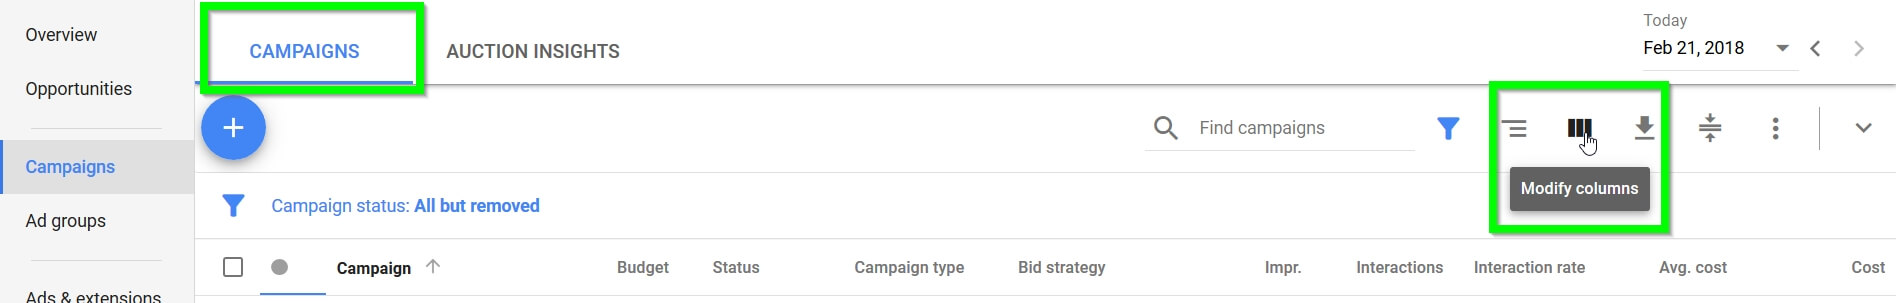
Log into Google Ads and make sure you are in the
Campaigns tab on the
Campaigns page. Then click on the
Columns drop down list and select
Modify columns…
Step 2
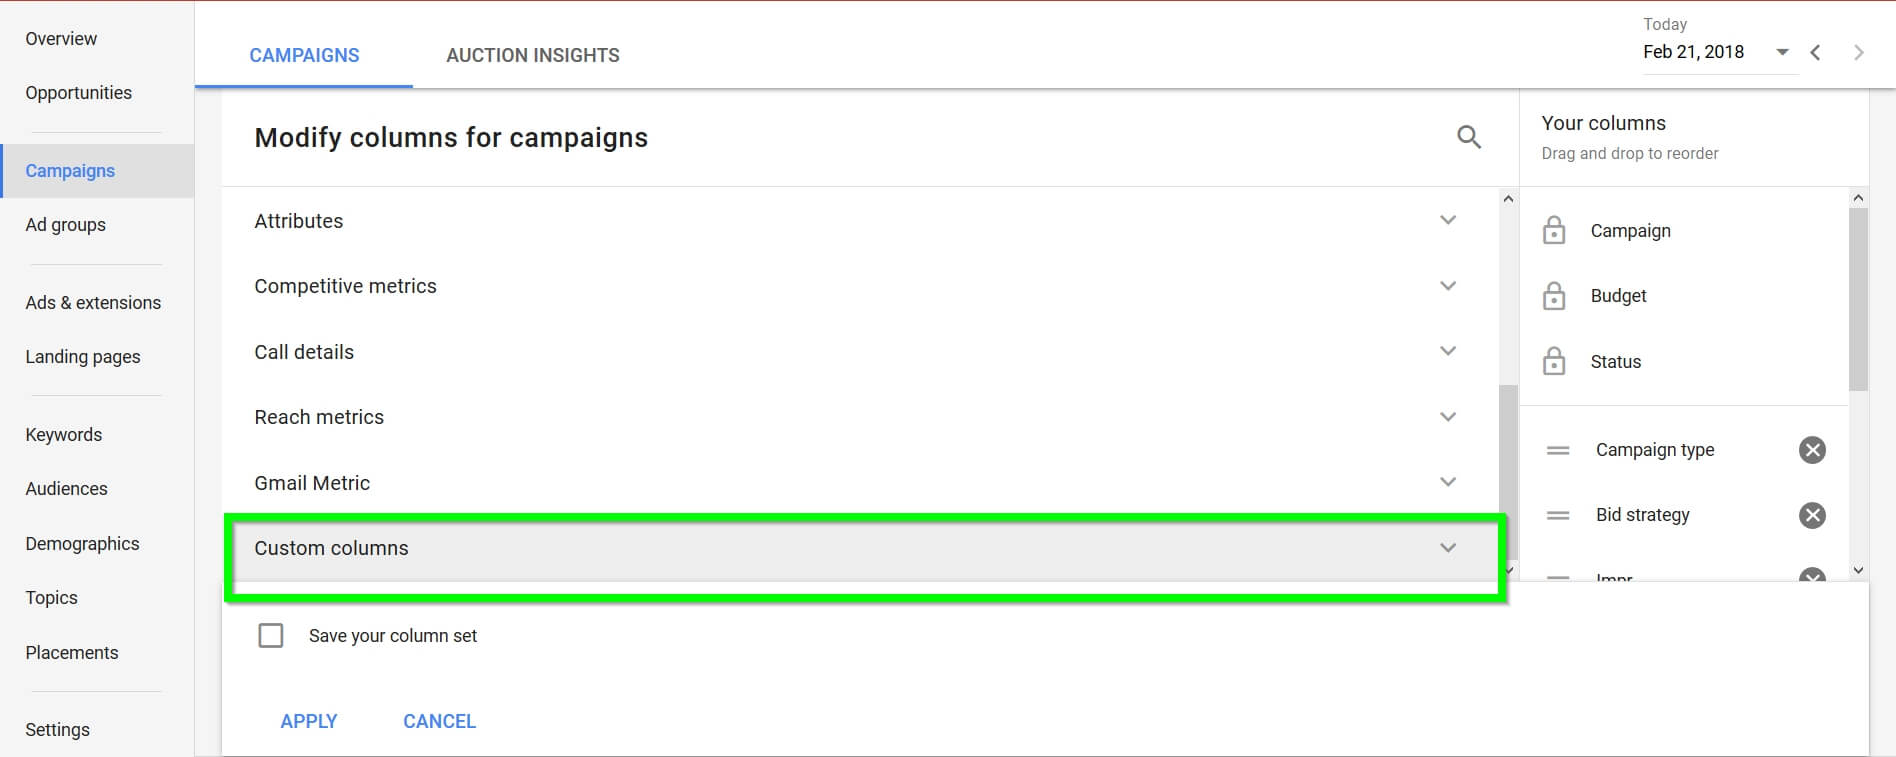
From the
Modify columns for campaigns list click on
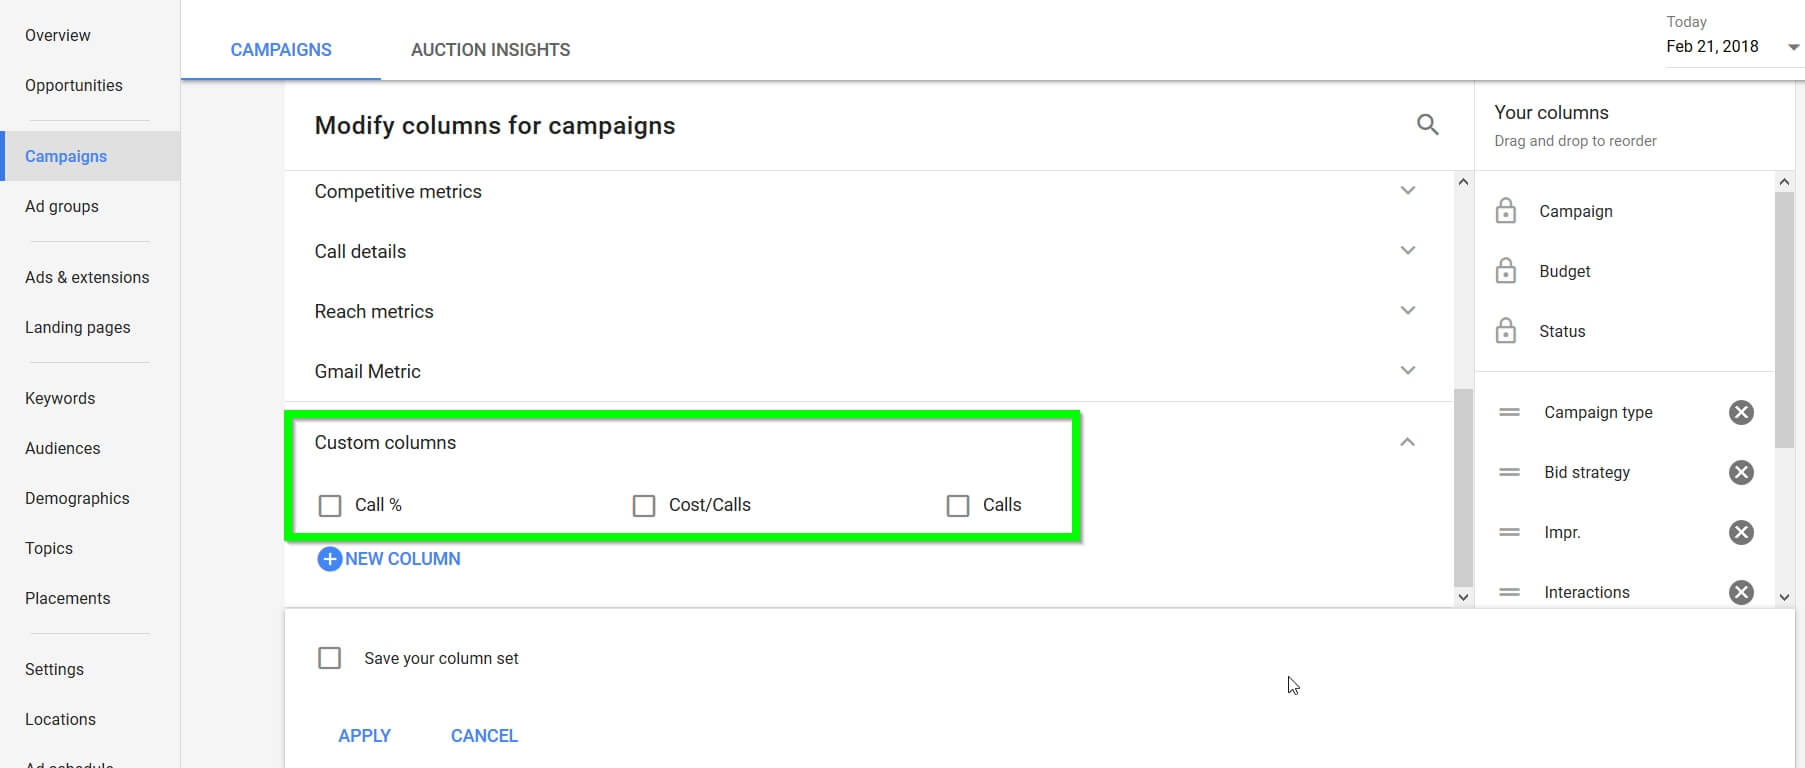
Custom columns
Step 3
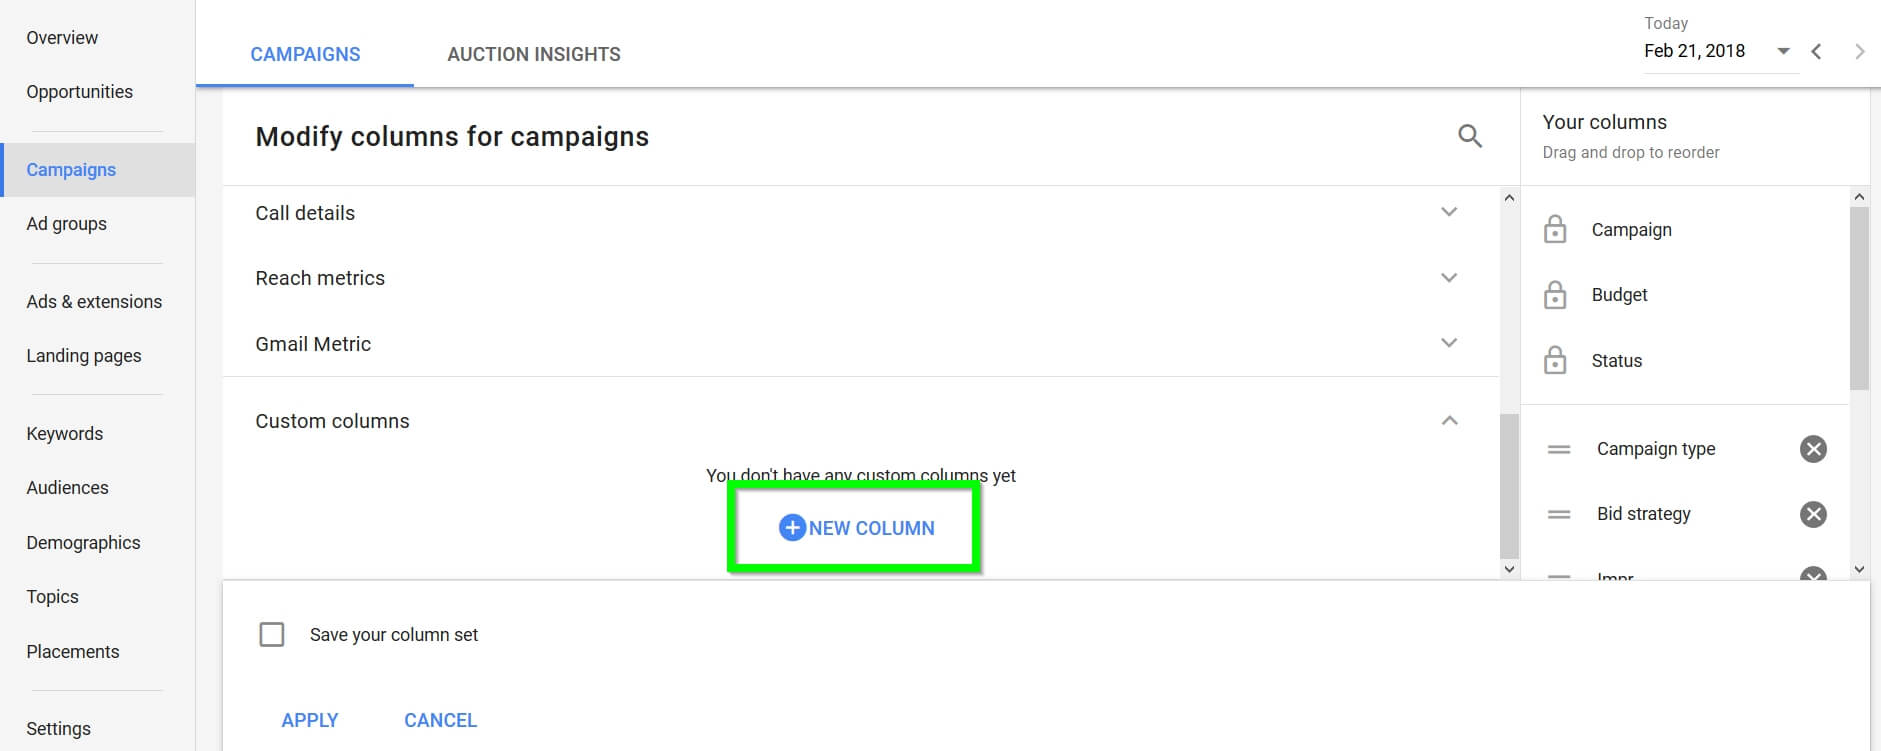
Select
New Column
Step 4
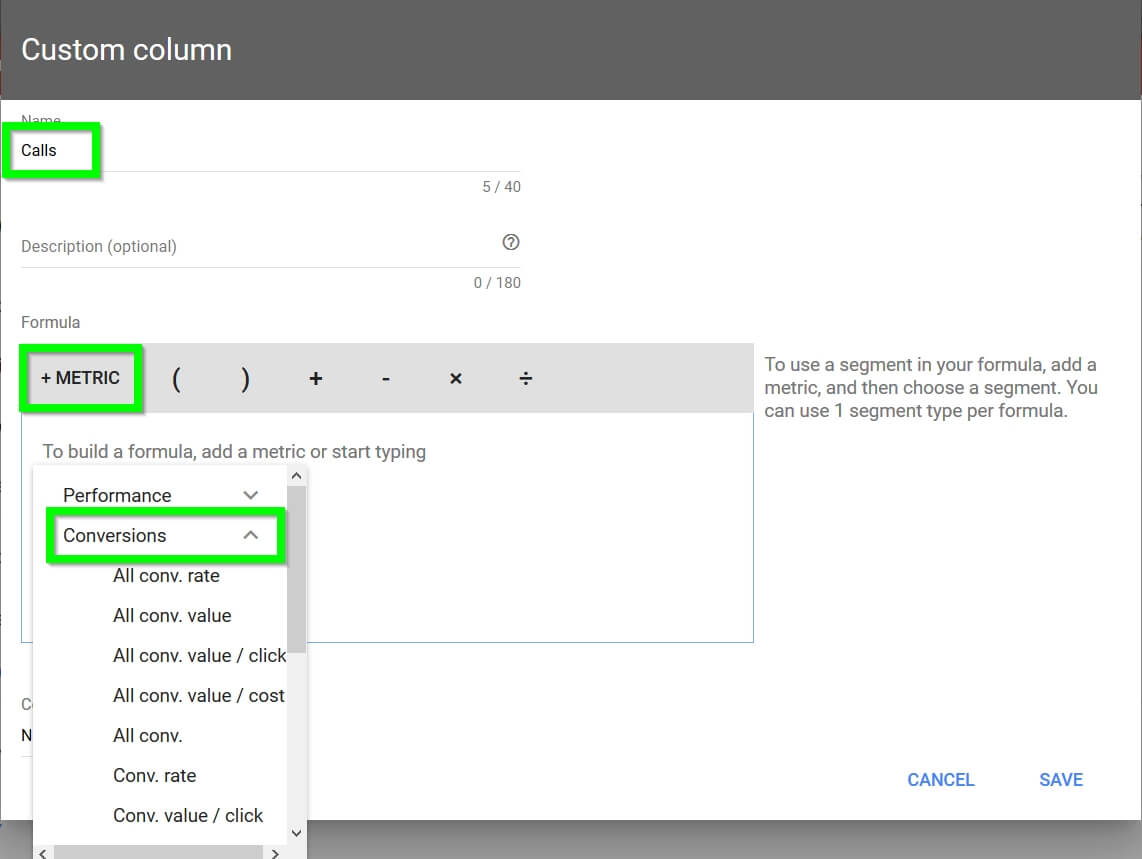
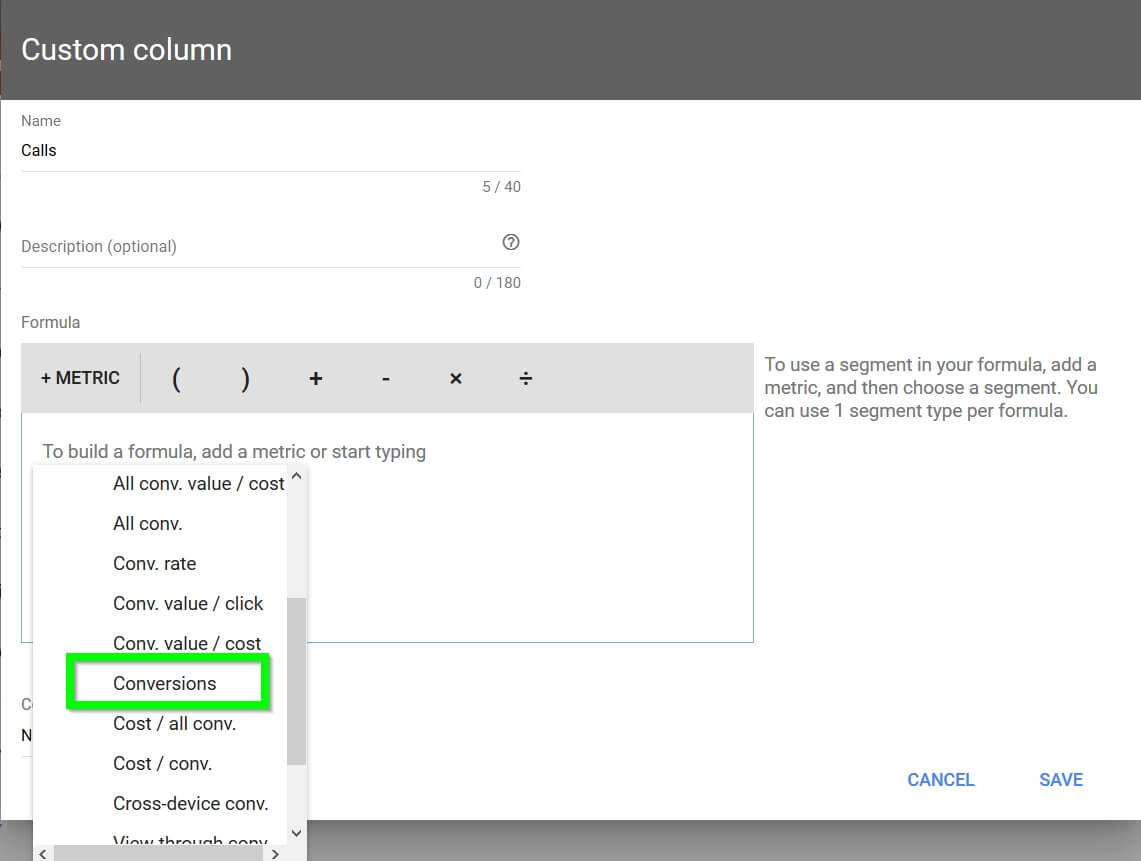
In the pop-up window that opens, name the column
Calls and in the
Metric drop down list select
Conversions.
Step 5
Scroll down and select
Conversions again
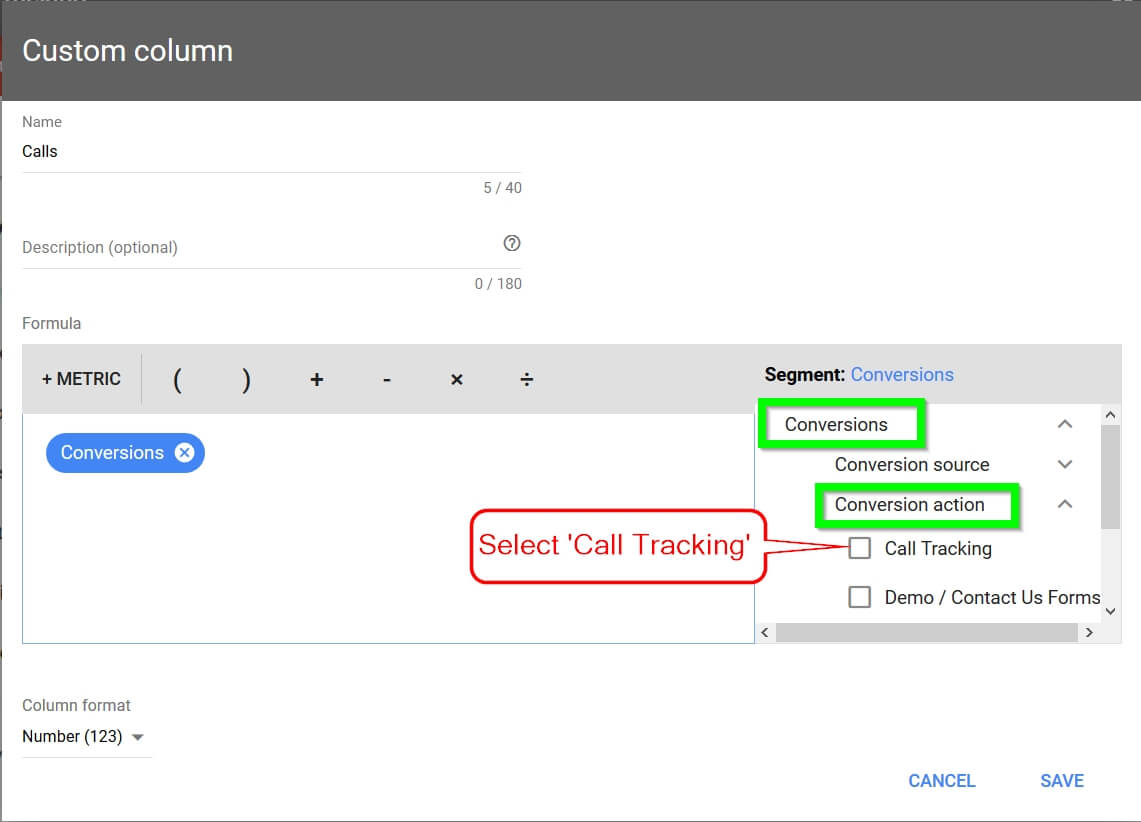
Step 6
A blue ‘conversion’ graphic should appear, along with a menu box to the right. Click the arrow to the Right of
Conversions. Then click the arrow to the right of
Conversion action. Then check the
Call Tracking check box.
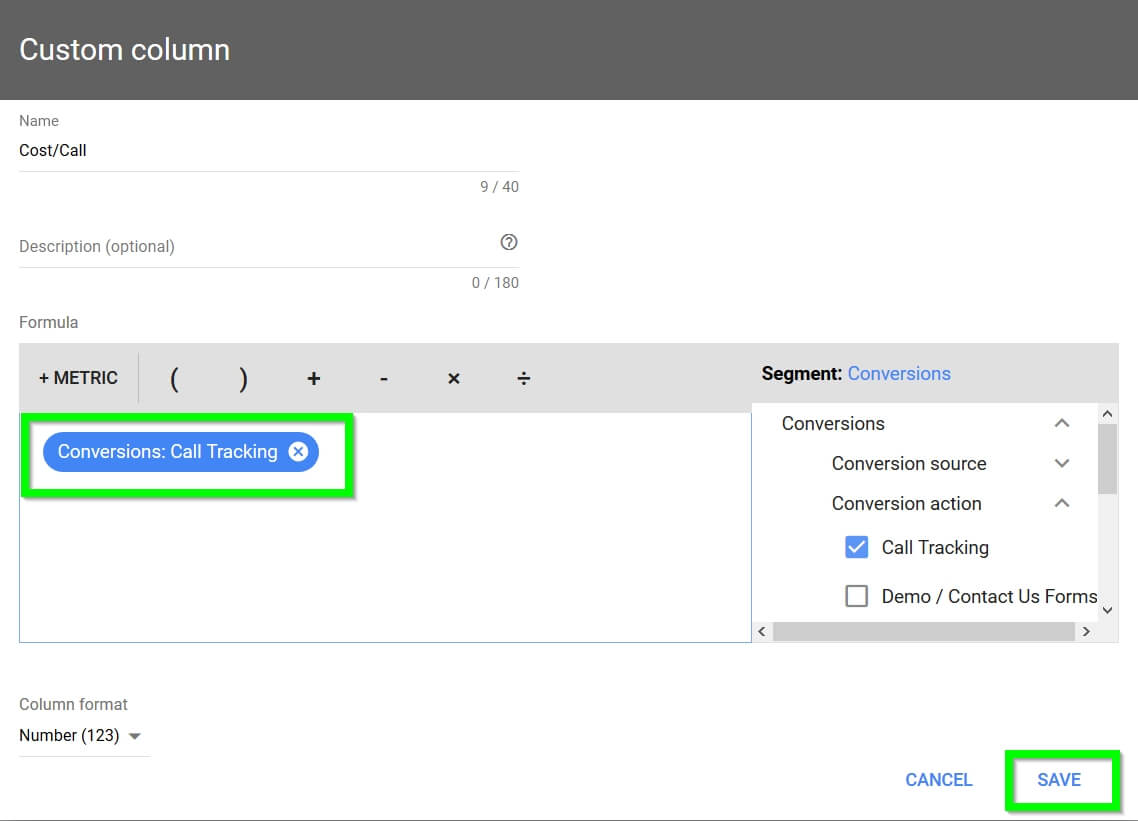
Step 7
The blue ‘conversion’ graphic will have updated to become ‘
Conversions: Call Tracking‘. Next, select
Save to create a new custom column.
Step 8
Click on the
+ New Column button to add a new
Cost/Call new column.
Step 9
In the pop-up window that opens, name the column
Cost/Call and in the Metric drop down list select
Conversions.
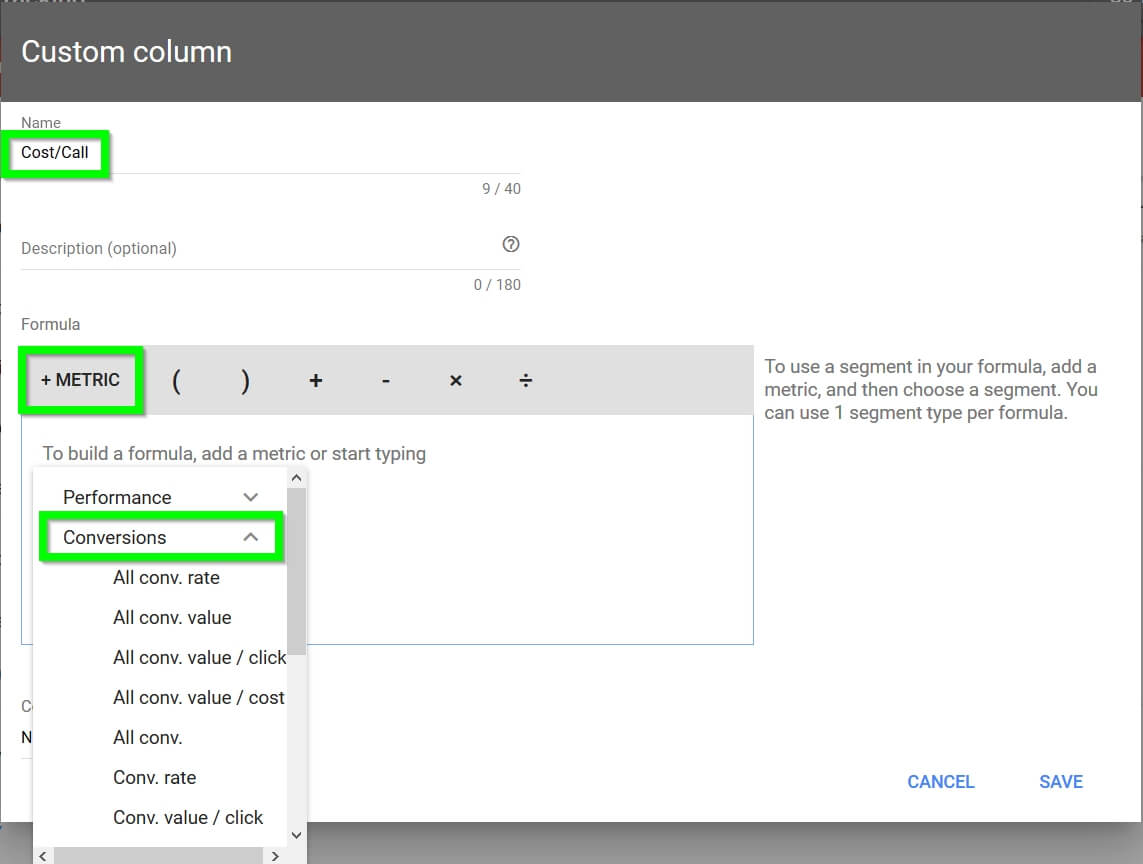
Step 10
Scroll down and select ‘
Cost / Conv.’

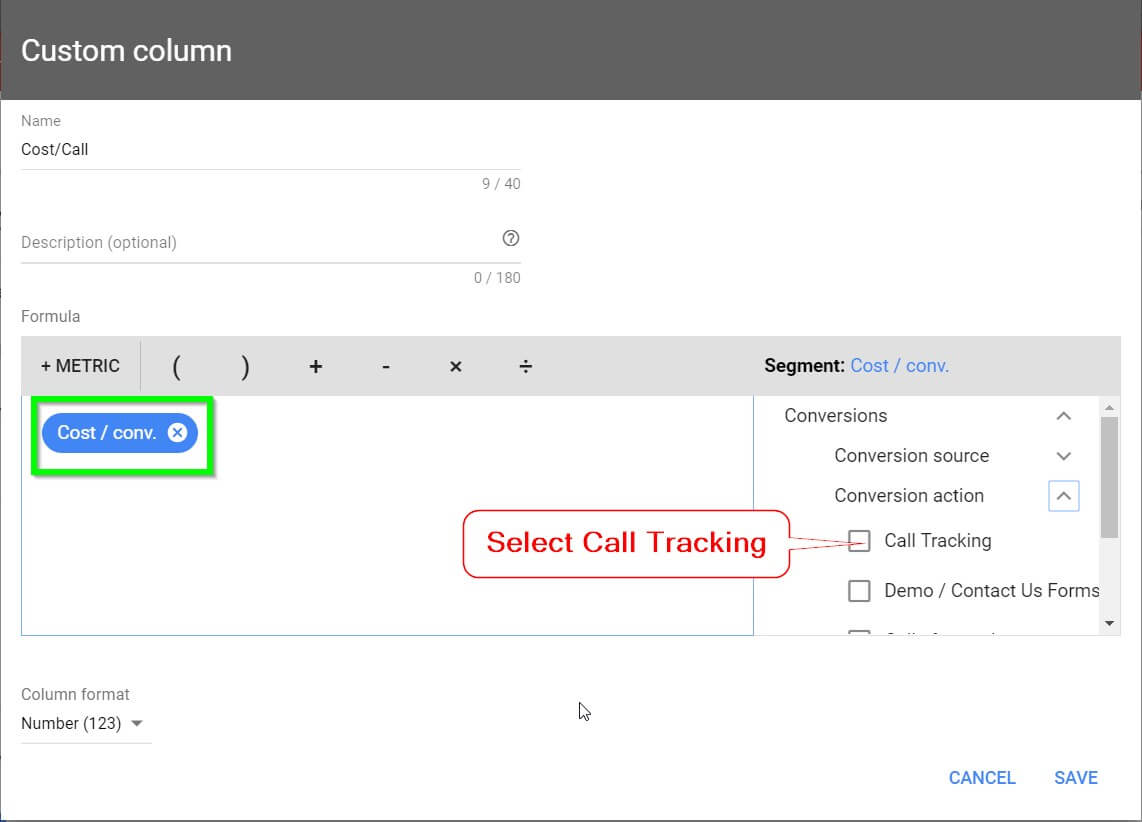
Step 11
A blue ‘
Cost/ conv.’ graphic should appear, along with a menu box to the right. Click the arrow to the Right of
Conversions. Then click the arrow to the right of
Conversion action. Then check the
Call Tracking check box.
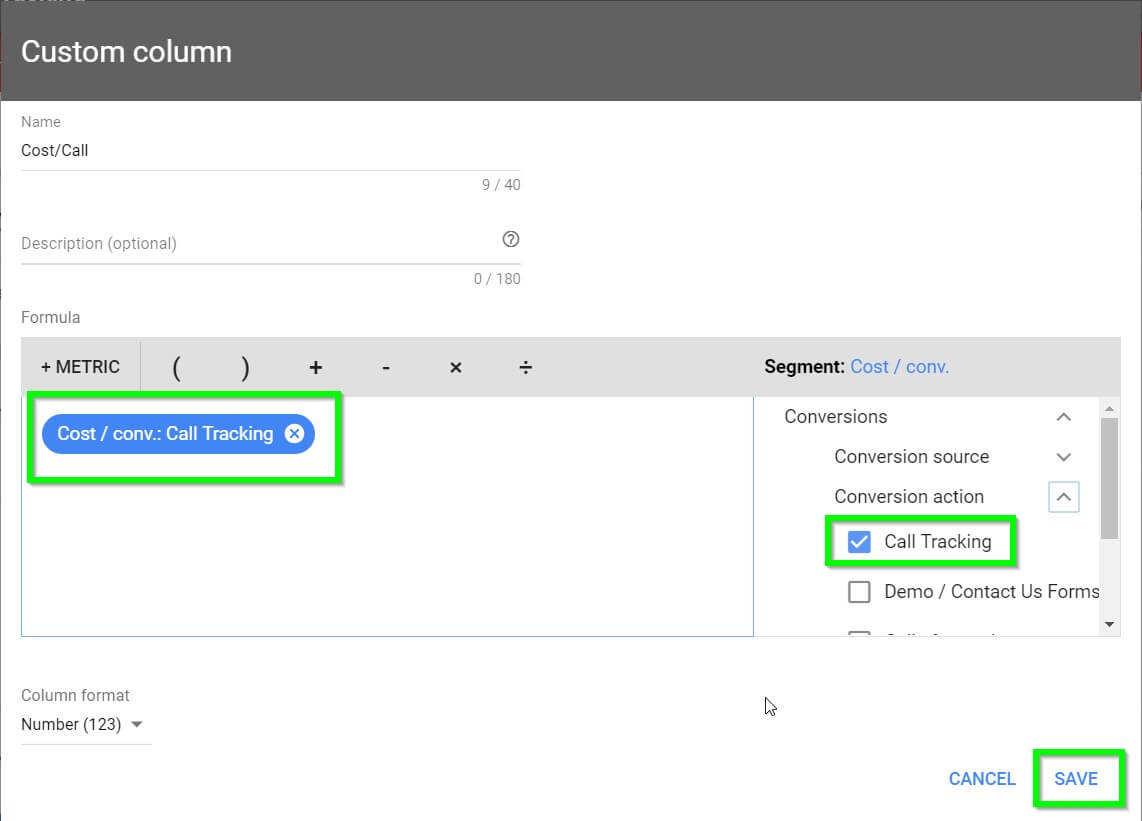
Step 12
The blue ‘
Cost / conv.‘ graphic will have updated to become ‘
Cost / conv.: Call Tracking‘. Next, select
Save to create a new custom column.
Step 13
Add one final column by clicking on the
+ Column button to create a
Cost % column.
Step 14
In the pop-up window that opens, name the column
Cost % and in the Metric drop down list select
Conversions.
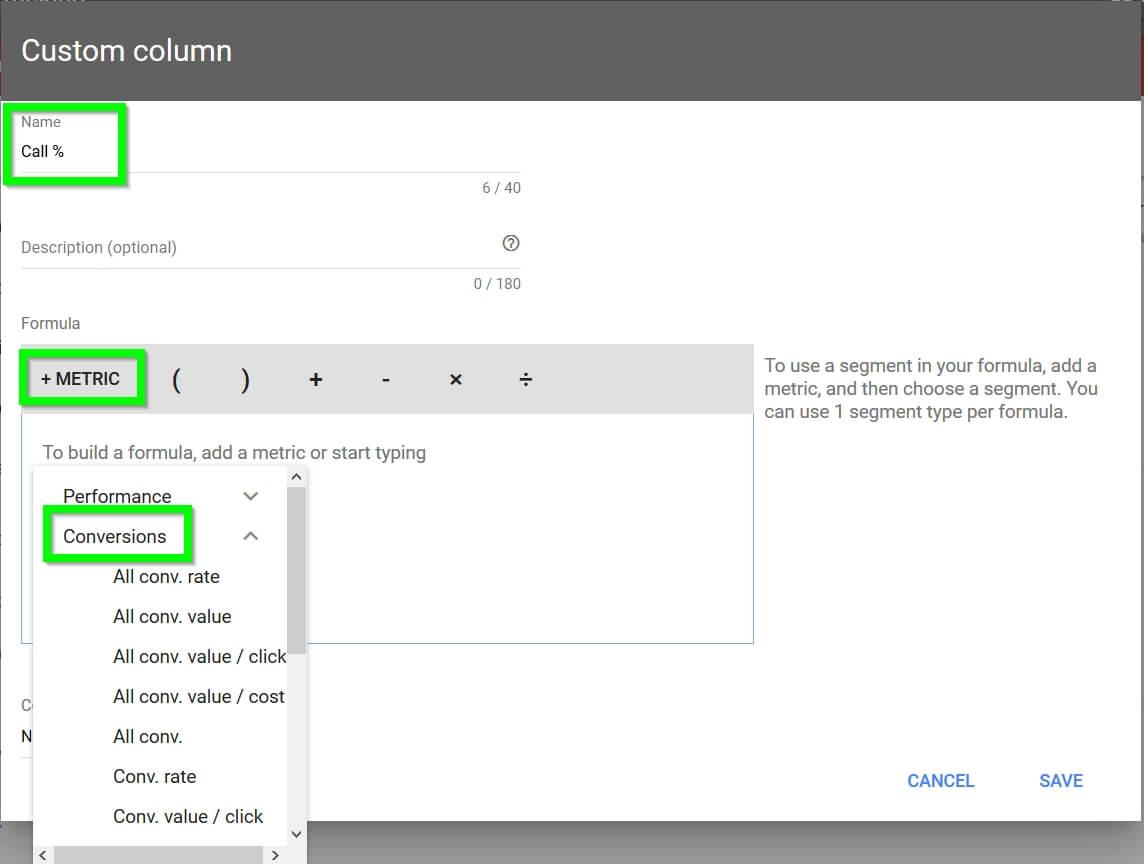
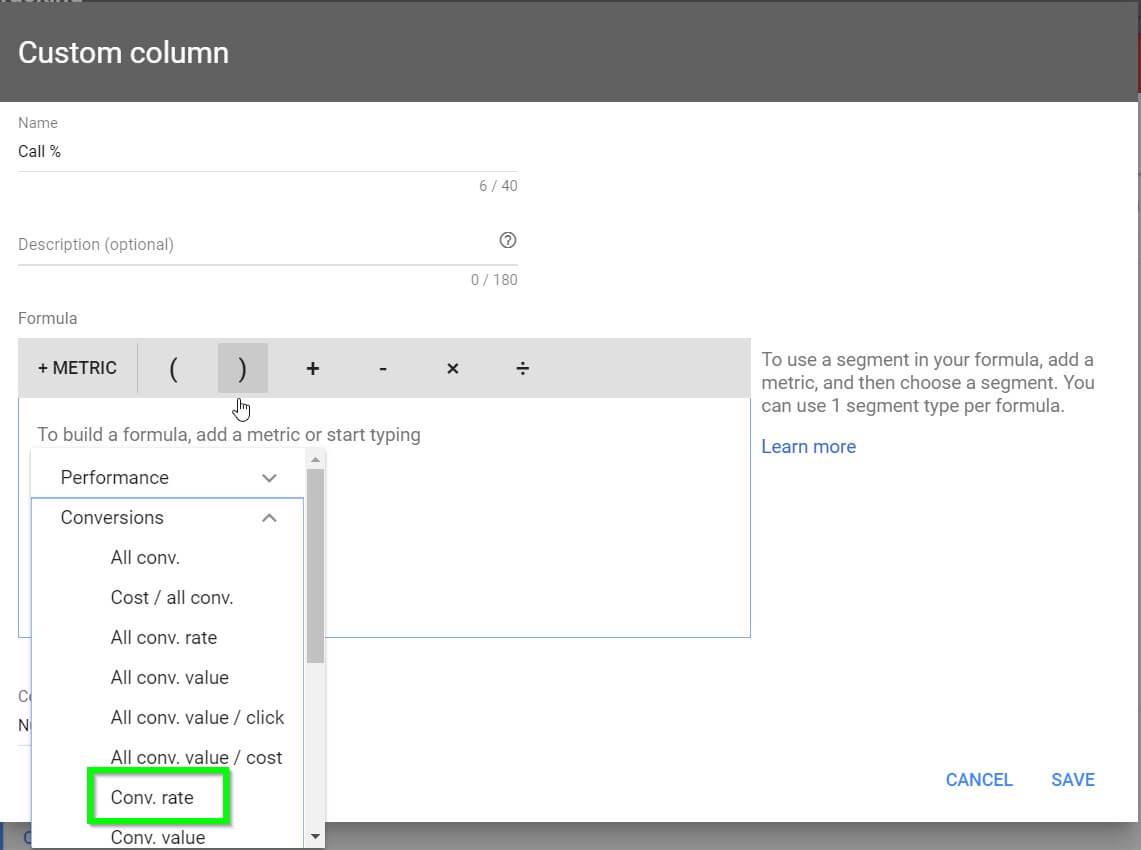
Step 15
Scroll down and select
‘Conv. rate’.
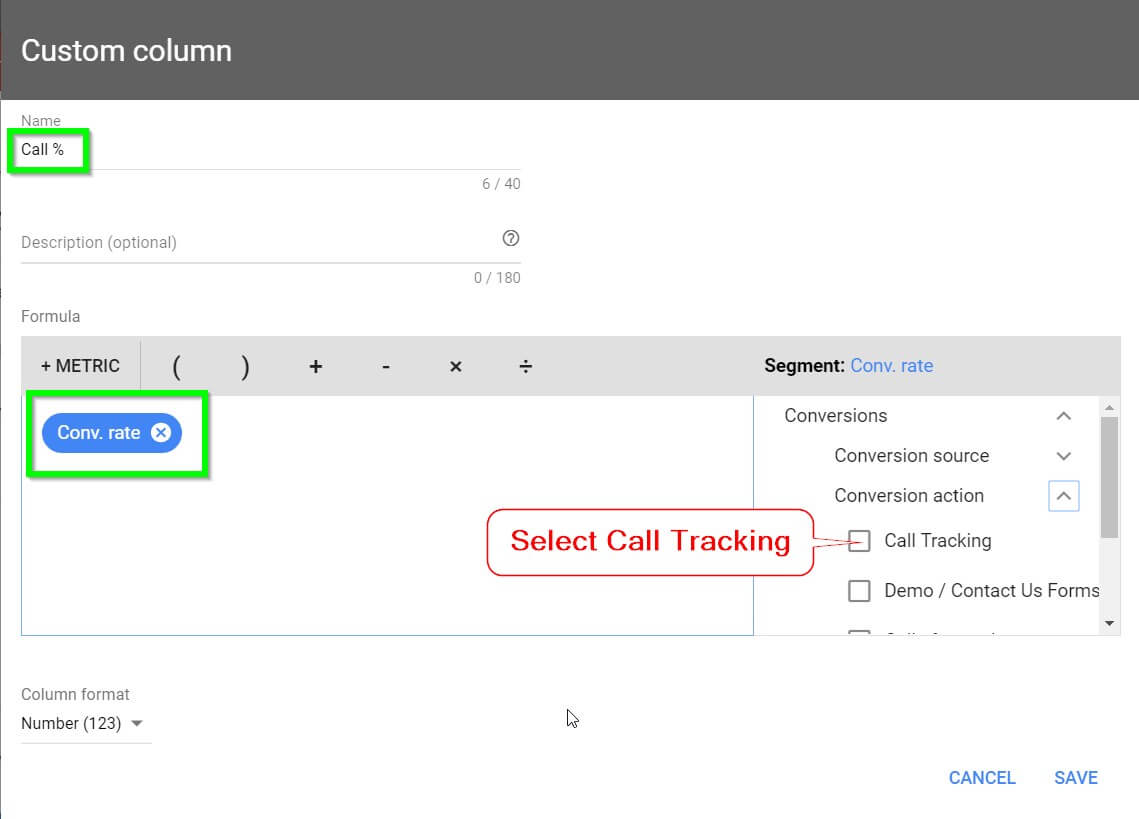
Step 16
A blue ‘Conv. rate‘ graphic should appear along with a menu box to the right. Click the arrow to the Right of
Conversions. Then click the arrow to the right of
Conversion action. Then check the
Call Tracking check box.
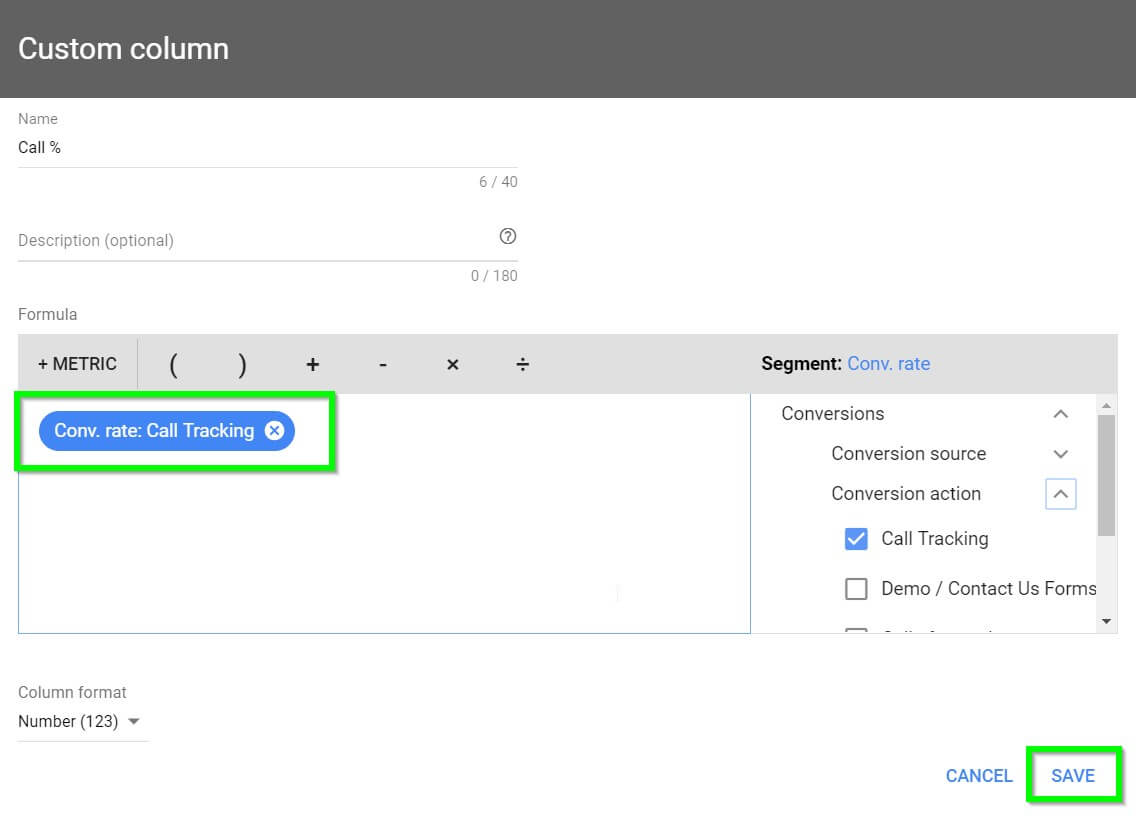
Step 17
The blue ‘
Conv. rate‘ graphic will have updated to become ‘
Conv. rate: Call Tracking‘. Next, select
Save to complete your set-up.
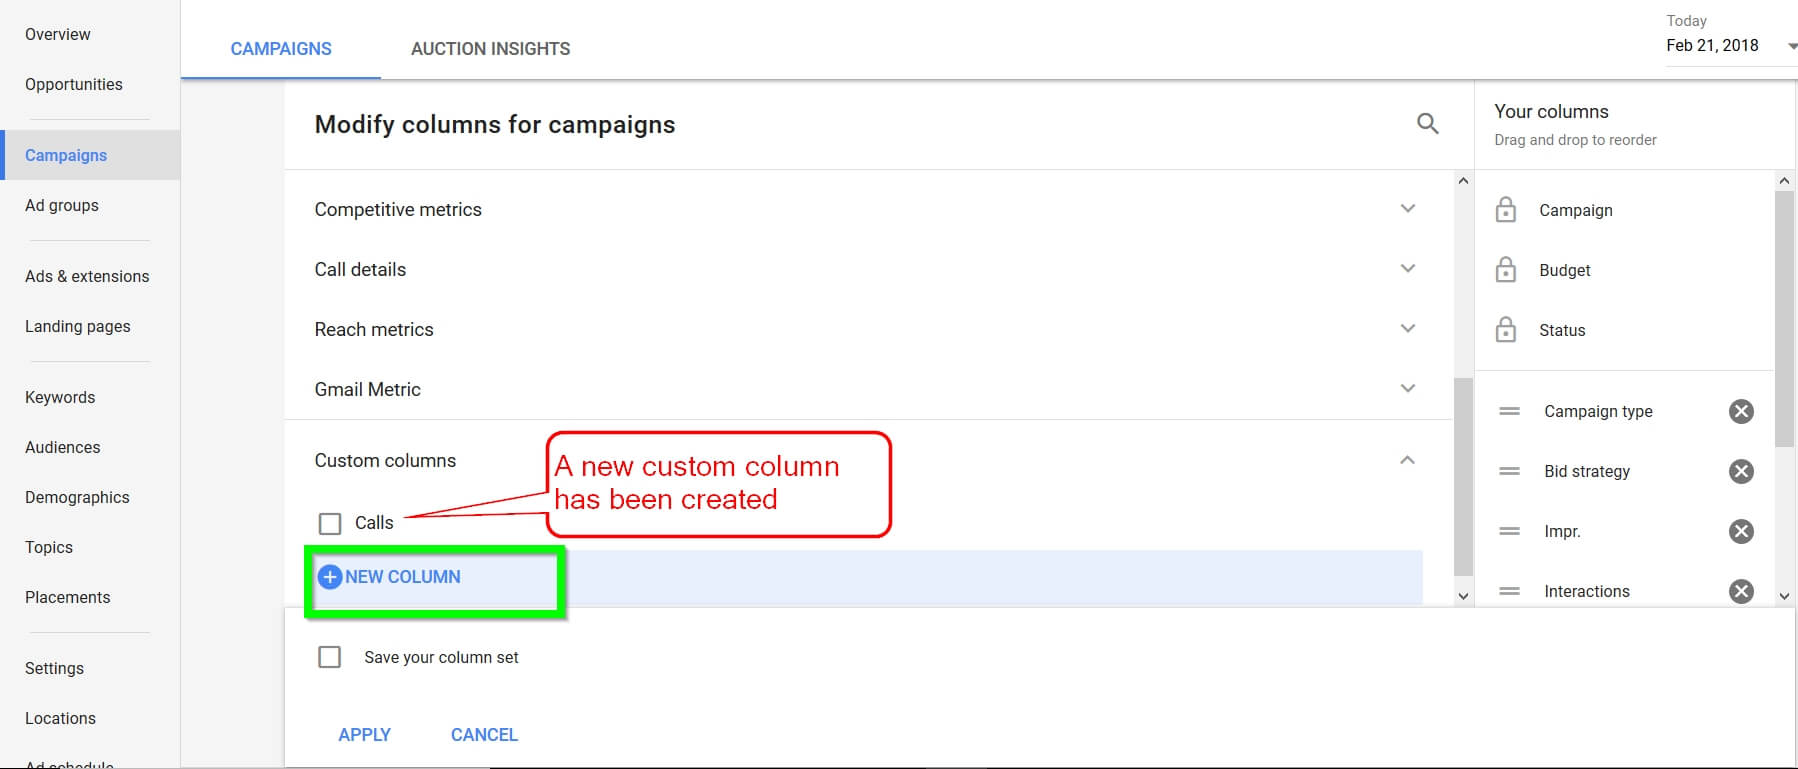
Step 18
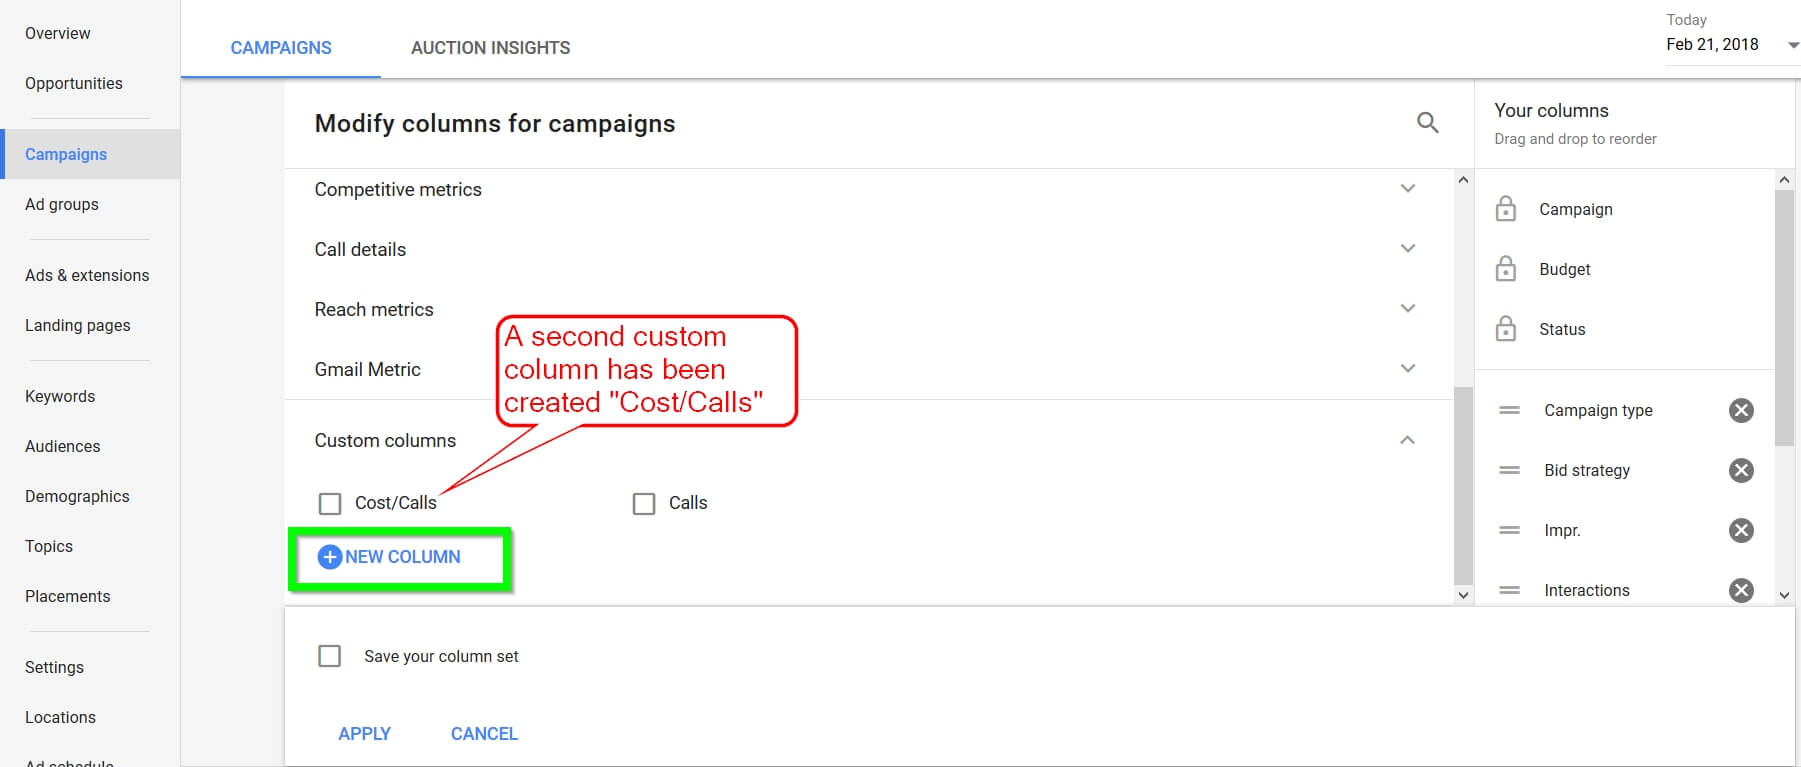
You should now see your 3 new custom columns in the custom columns section. Select the column you want to display to reveal these metrics in your data sheets.
Leave a Reply